
Analytics and machine learning are all about data. The quality and quantity of your data plays a critical role in determining the effectiveness of the models. But even with reams of the best data, if your process doesn’t use it properly, your results will be dubious.
All stages of the process must not only use the exact same data but the same interpretation of its meaning. There are three stages to the analytics process: Describe, Predict, and Prescribe. Ideally, each of these stages revolve around a feature catalogue that delivers a standard view of the data and includes business meaning. For example, it will have a feature (or attribute) called “Business Address” as opposed to “address number 5 of type 37 in collection X.” Did you understand the second one? Neither did I – and that means it’s open to be interpreted differently by each data scientist assembling data sets.
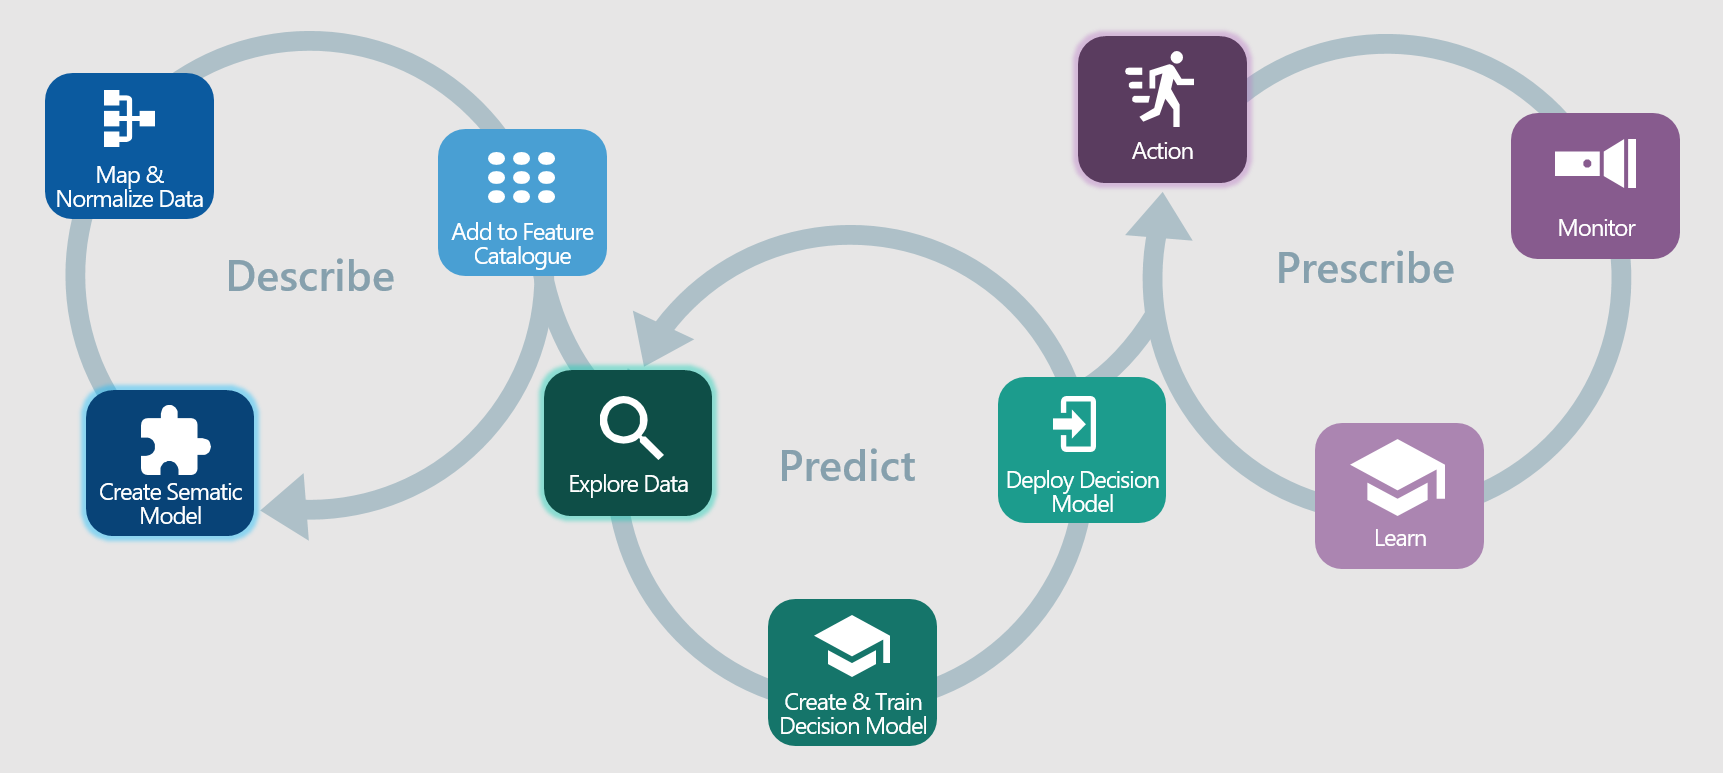
Describe:
The first stage in building the feature catalogue is to create the semantic model. The semantic model is a virtual model of the data that is completely abstracted from the data sources. It allows you to concentrate on the business description (semantics) and the usage of the features without worrying about where they come from or how they are stored. There’s no need to build the entire catalog at once. You can start small and grow it over time.
Next you map the features to actual data sources. If there are conflicting sources, you can centralize the rules to resolve conflicts and inconsistencies. Because the rules are centralized, you can guarantee that everyone who uses the feature catalogue will use the same rules. It’s also cheaper then maintaining ETL. With ETL, every analytics problem comes with new ETL code which replicates the same logic as previous code for resolving the conflicts. The code bloats very quickly.
Finally, you expose the data in a catalogue shared by everyone.
Predict:
Now comes the machine learning. First, you start with the data analysts and data engineers who explore the data. They use industry standard tools like Sparc, Zeppelin, and Jupyter to look at the data, understand what it’s saying, and determine which features are important to solve a given problem. Sometimes they need additional data, at which time they can go back into the Describe loop to map some new features; sometimes they need to create a new feature with a calculation of one or more correlated features. In either case, new features are added to the catalogue and are available for anyone to use. When data discovery is completed, data scientists will have a list of features required for machine learning.
Before we continue, let’s take a step back and discuss the traditional way data exploration and machine learning happens. For data exploration, data scientists, data analysts, and data engineers compile data requests for back-office fulfillment. The back-office makes a guess at which attributes in which systems are relevant and gives a spreadsheet or data dump to the explorers, who do their magic. When they are done, the explorers hand over a document that lists the required features to the data scientists. What do the data scientists do? They go back to the back-office and request more data. The back-office personnel, likely different people, will gather the data they think is relevant and hand it over in a spreadsheet or data dump. Notice the problems here? First, the data is definitely stale. Second, the data is likely not consistent because different back-office people interpreted the meaning and probably pulled from different systems.
A feature catalogue solves this because everyone is using the exact same features that expose the exact same data and the data is always up to date.
The data scientists use their skills to train and test a machine learning model and deploy a decision model that can be wired into front office applications. Once again, the decision model is going to use the exact same features that were used in data exploration and machine learning, ensuring the consistent application of the machine learning model.
Prescribe:
The decision model can now prescribe what a user should do. In wealth management, this could be the next best action that will increase customer loyalty and encourage a customer to invest more; in corporate banking it could be a recommended product and sales methodology to advance the account plan for a high value client. In either case, the system monitors the results of the actions over time and passes the results back in a feedback loop to enable continuous learning. As bankers and advisors use the system and accept the recommendations or do something else, the system will monitor the results and make better recommendations the next time.
With a single feature catalogue participating in all stages of the analytics process, firms can be assured that decision models will be consistent, more accurate and, most importantly, continue to learn as advisors and bankers use the system.
How do you provision data for machine learning? How do you get the resulting decision models into the hands of the people who need them?

